Sentiment Analysis Report
Last updated August 28, 2025
What is the Sentiment Analysis Report?
The Sentiment Analysis Report helps you gain a broader understanding of your audience's comments and feedback. This is accomplished through the tracking of specific keywords from your audience's recently completed surveys.
It can be found under the MyCustomerVoice menu once you login on Desktop:
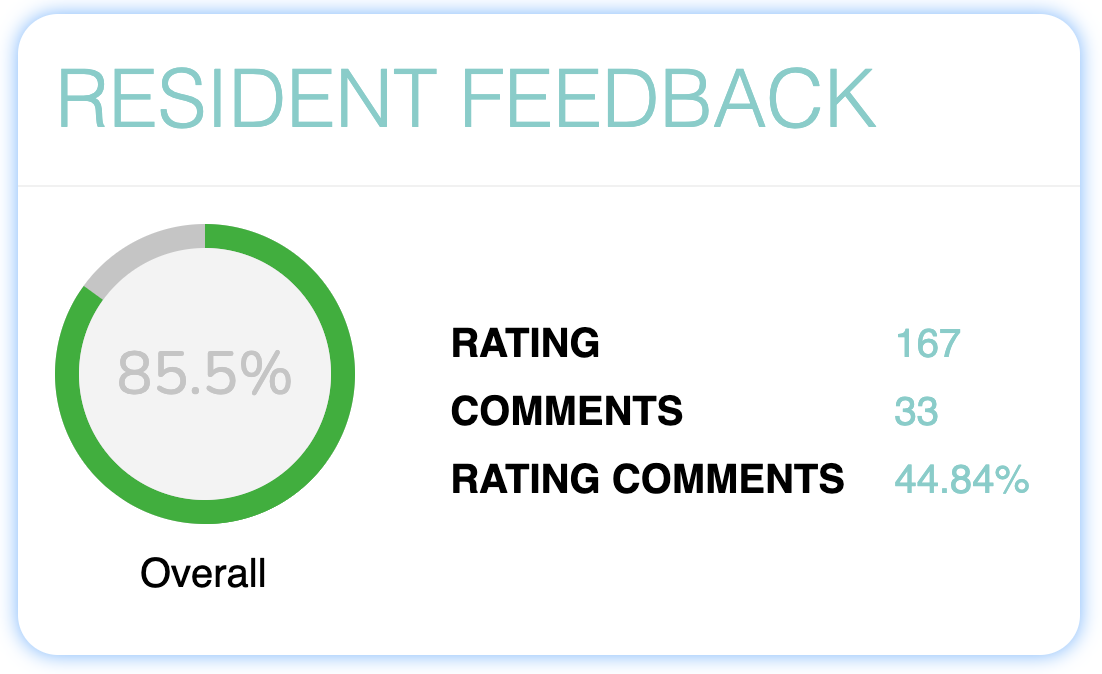
Once you choose your Location, Audit, and Date Range, you'll see a window giving you an overall score for your surveys:

Rating: total # of questions answered across all (selected) audits within dates
Comments: total # of comments added to questions
Rating Comments: average rating of questions that have comments attached
What about the keywords?
Those are setup by your product owner. Head to the Admin Panel, then Surveys:
Choose which audit you want to add keywords to, then click the pencil icon to edit:

From there, go to the Add bubble and begin adding keywords you want to track.
Make sure you are saving them using the floppy disk icon:

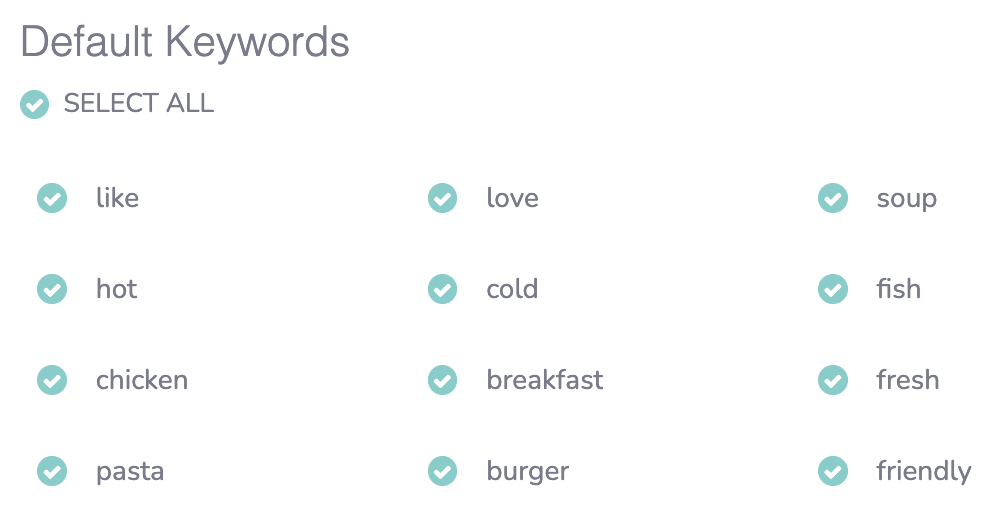
Once you head back to the Dashboard, you'll see all of your added keywords:
Keyword Combinations
For AND combinations, choose your two keywords and click the up arrow, then Enter:
Same thing for OR combinations, just click the down arrow:
Once your keywords are logged, it will analyze all of the surveys that contain them. This analysis will compare surveys using those keywords to the overall score of all your surveys, showing you the relative difference (variance):
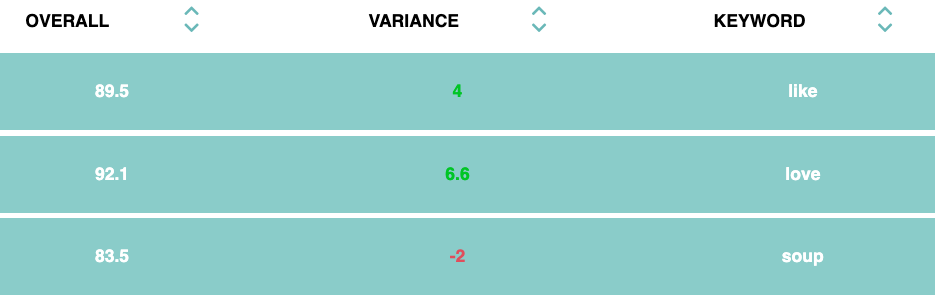
In this example, the Overall score across all surveys is 85.5%.Surveys containing the word "like" averaged 89.5%, which is a +4% variance from the overall average. However, surveys containing the word "soup" averaged 83.5%, which is a -2% variance from the overall average.
You can also expand the view for each keyword to see which questions those keywords were commented on, the variance for that question, and how many times it was mentioned:
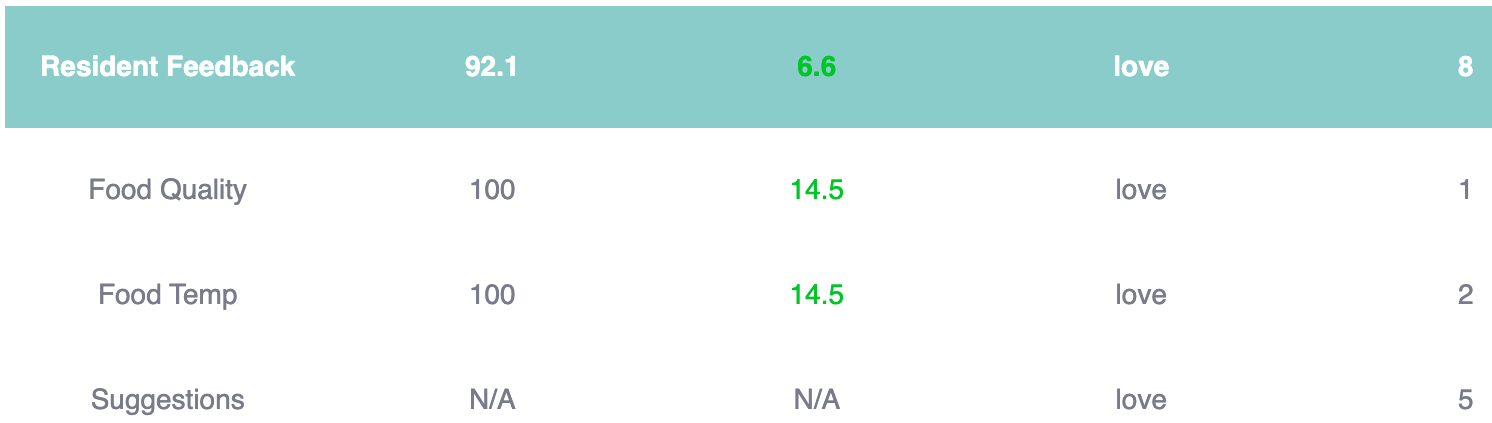
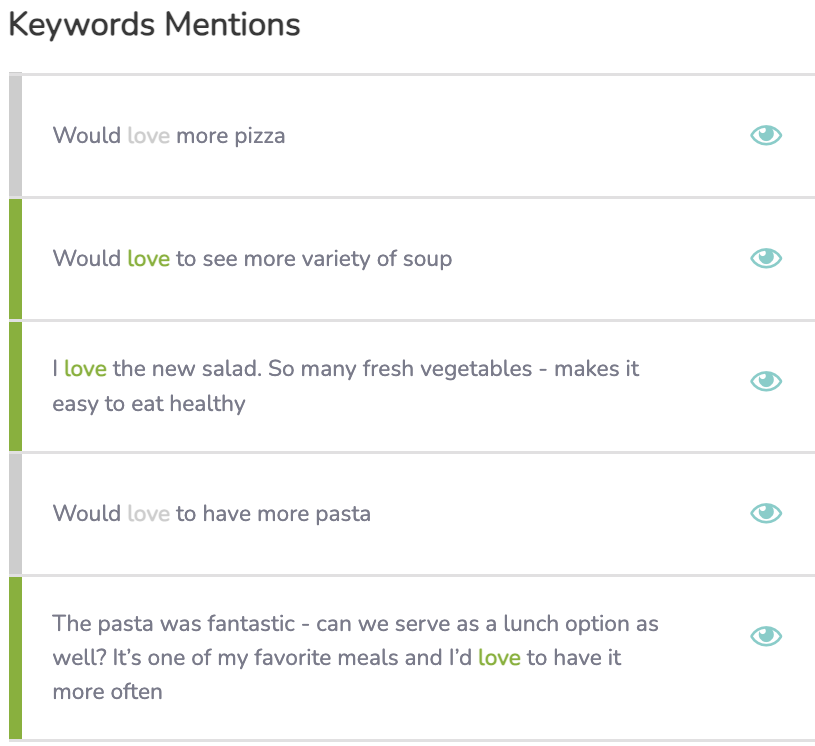
Once expanded, you can also see the comments that contain the keywords themselves:
If you'd like to learn more about other Reports on our platform, click here